Diversity in Higher Education
Interactive Infographic
Infographic Overview
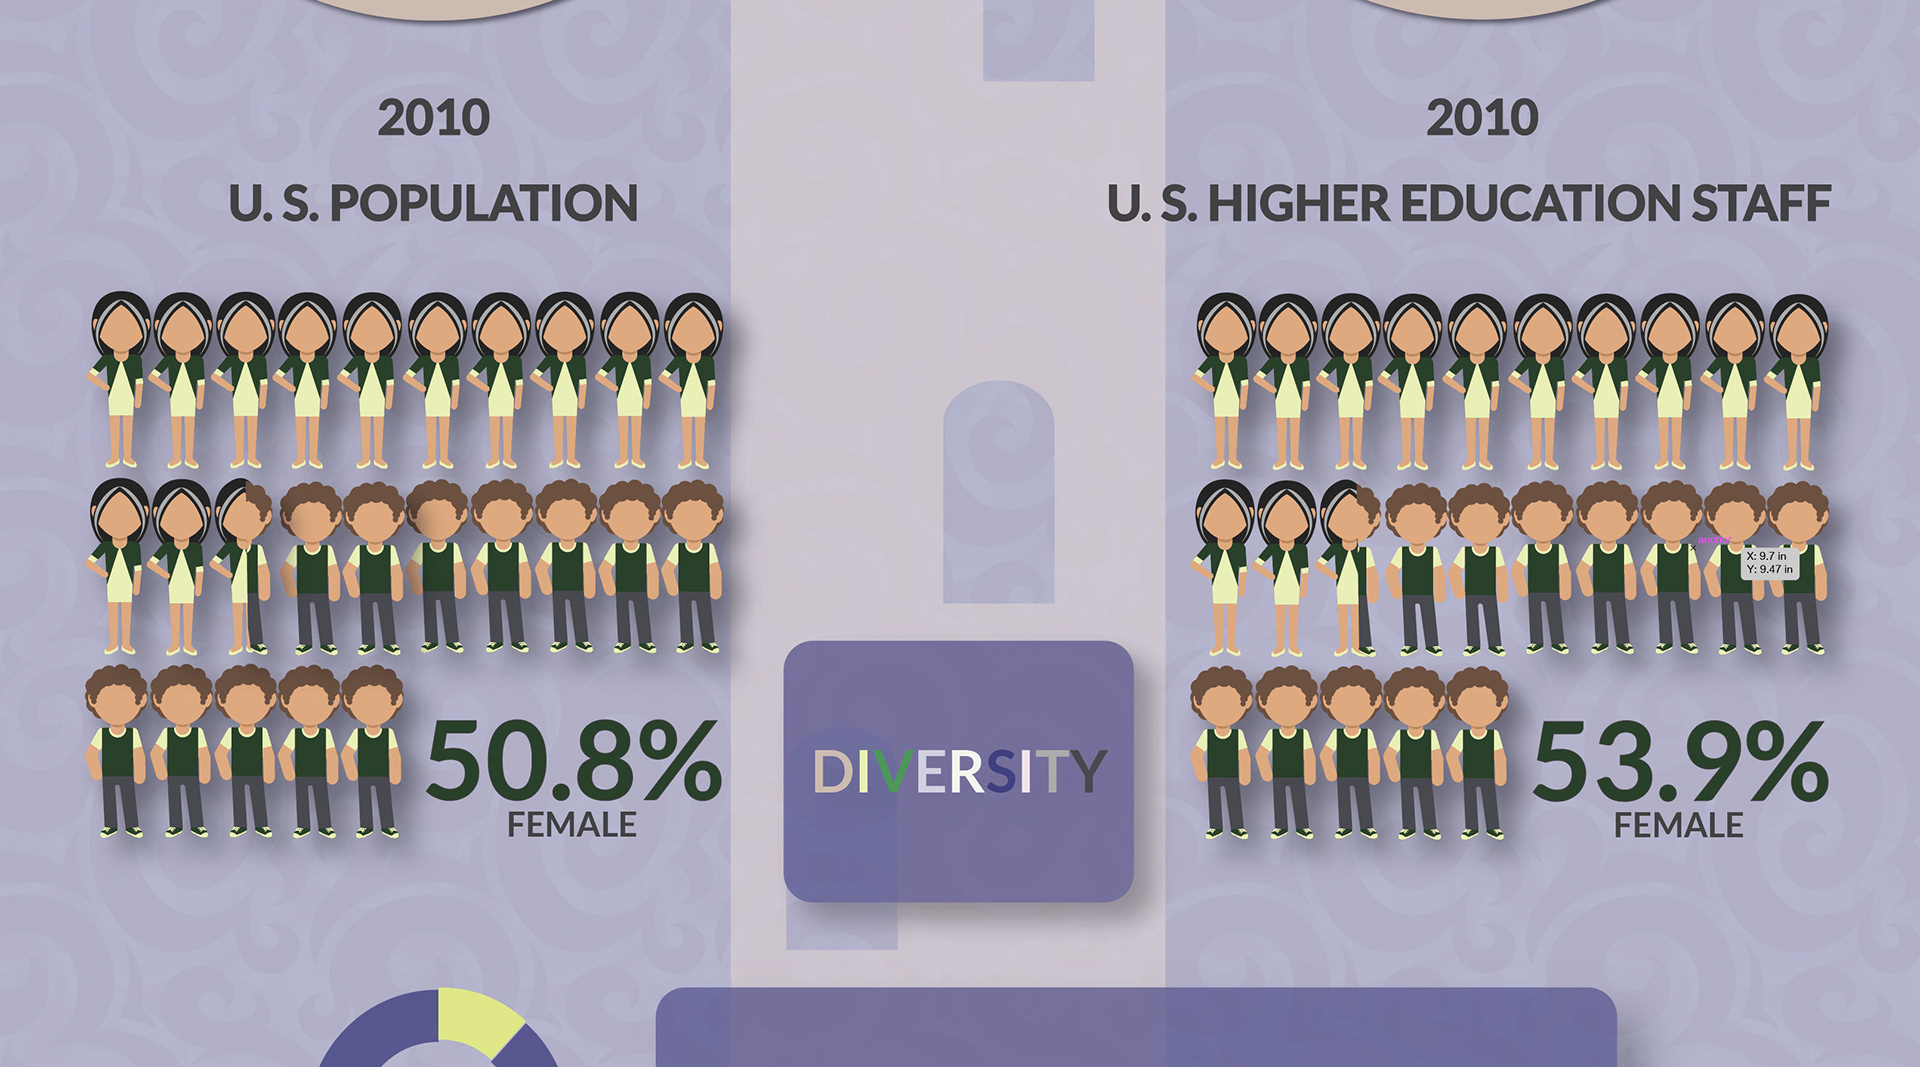
Faculty and staff at higher education institutions hear about diversity all the time. But how many understand what it is and how it relates to filling vacant positions? Diversity in Higher Education explains diversity, the American Disabilities Act, and the Equal Employment Opportunities Act while highlighting discrepancies between diversity in the United States’ population and higher education during the 2010 census year graphically.
Interactivity ScreenFlow Video
A brief video created with ScreenFlow to show the infographic’s interactivity. Hovering over the colored text within the colored boxes brings up a hidden layer explaining the box's terminology. Zoom features are used to help make the text more legible while watching.
Infographic Layers within Adobe Illustrator
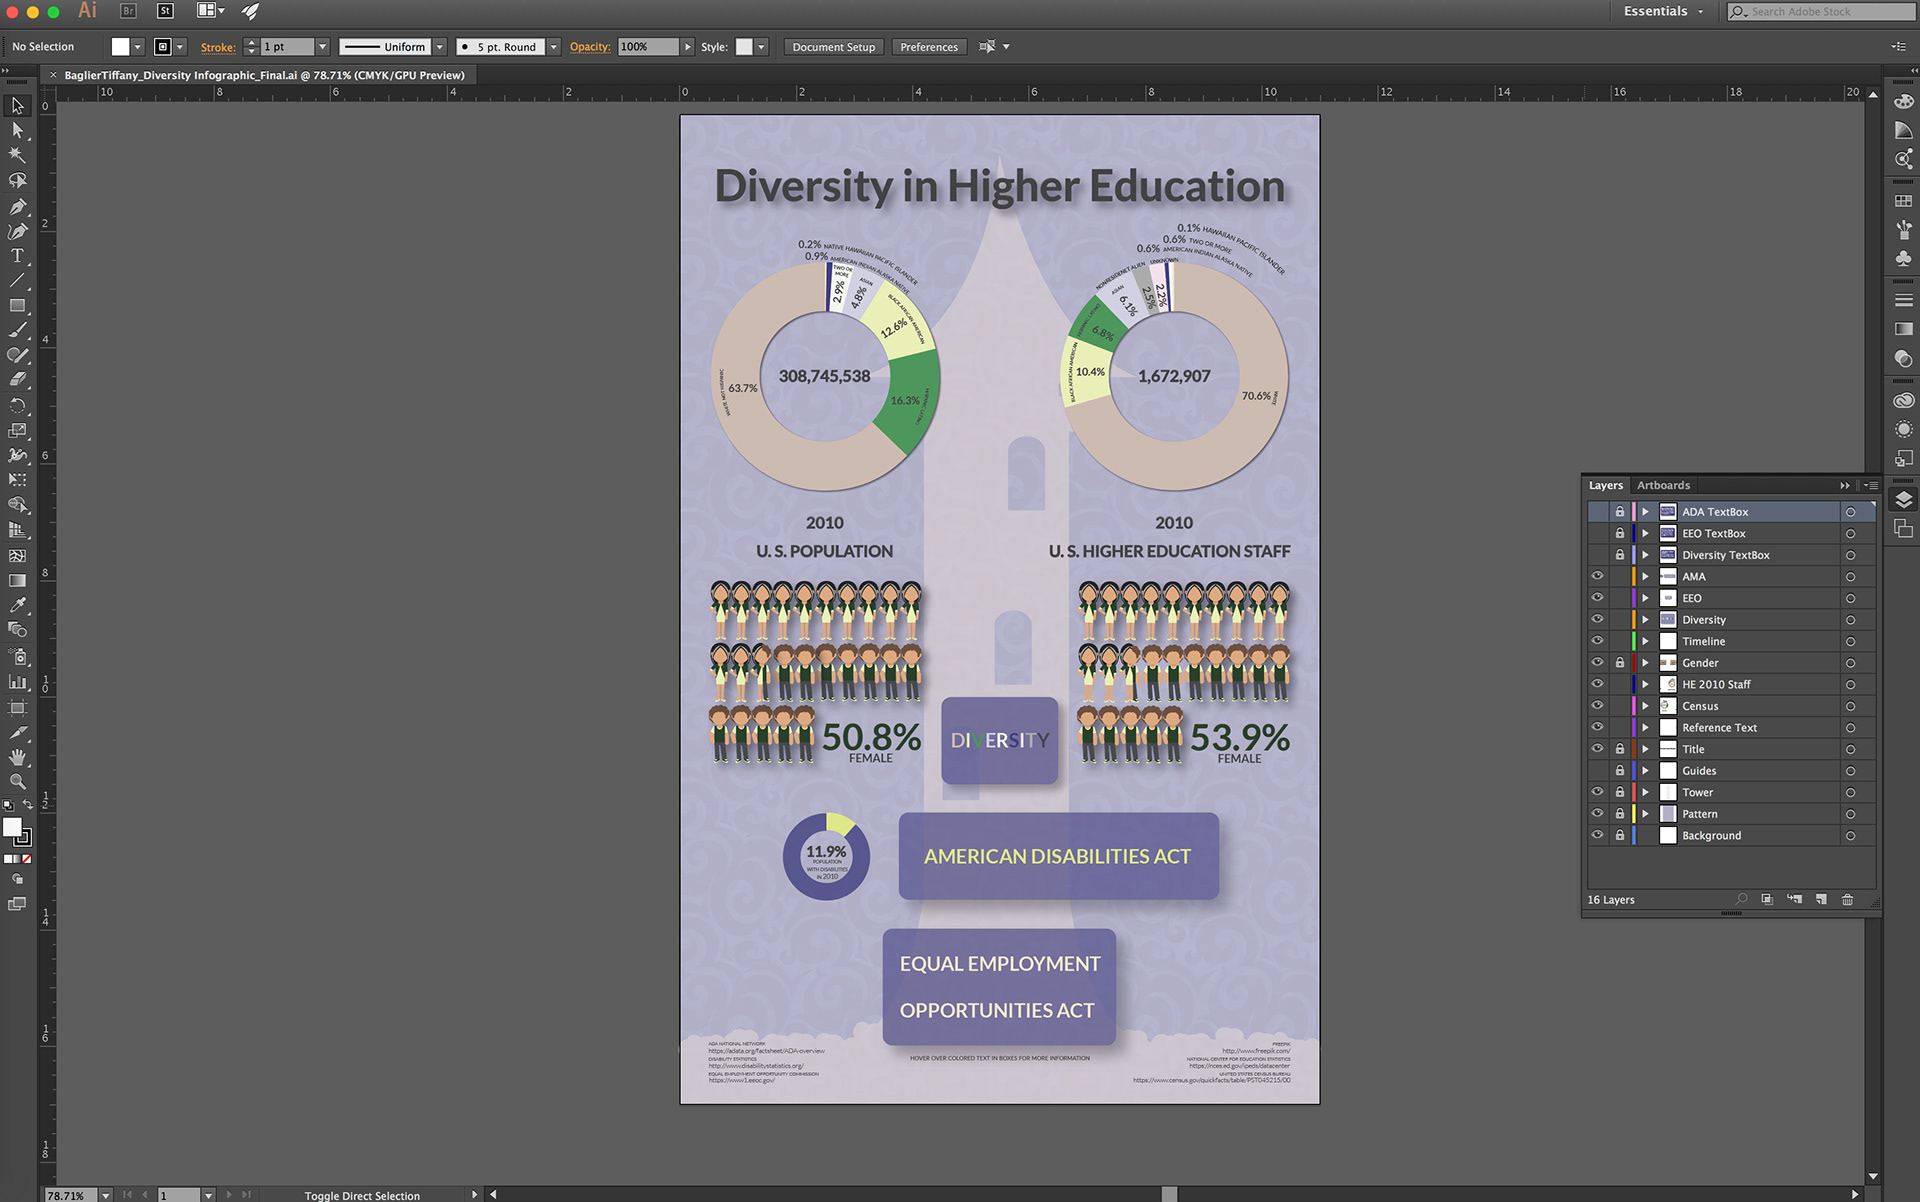
Adobe Illustrator was used to create the infographic. Through using layers within Illustrator, graphics, text, statistics, and guides are grouped and organized, making it easier to keep elements together and manage them. Layers can then be turned on and off, or regrouped before export into a PDF file.
Infographic Sketch
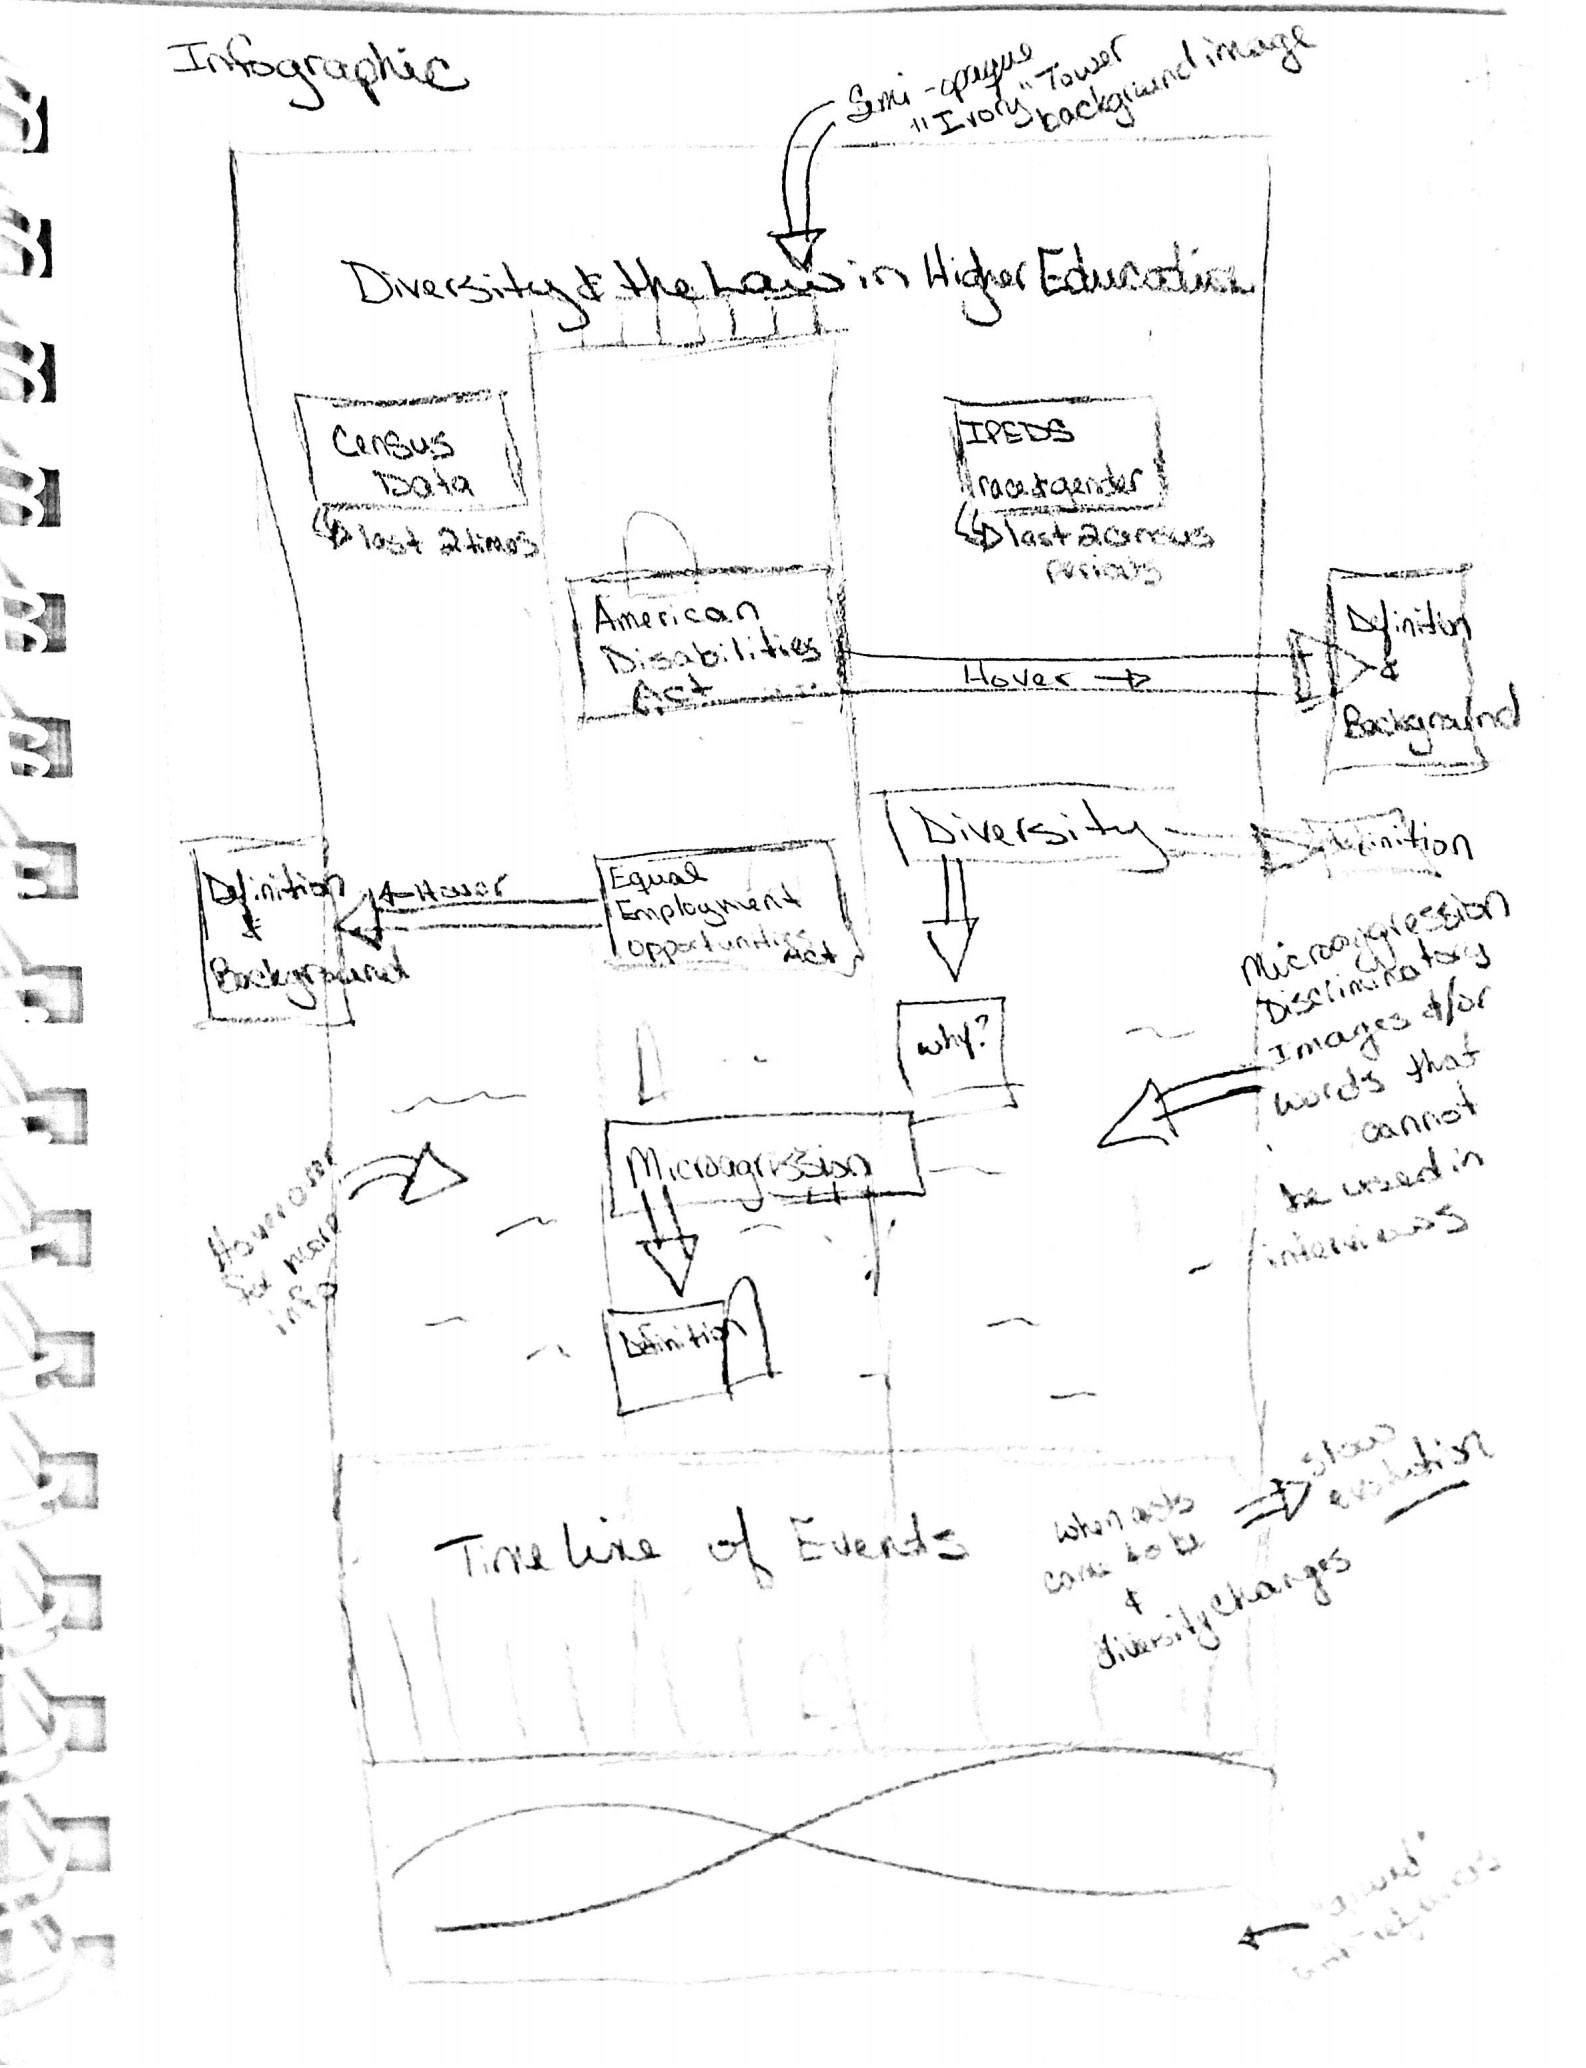
When designing an infographic, it is necessary to identify the information to be included and provide a general visual representation of how the information will be organized. While not all of the information was included in the final infographic, this sketch provided an overview of its content and alignment. The sketch was used as a reference when adding graphics, statistics, and text to the infographic within Adobe Illustrator.